Stop Managing Yesterday: How to Build KPIs That Actually Predict Your Future Success
Are You Measuring What Matters? A Guide to Choosing KPIs That Predict Success, Not Just Report It
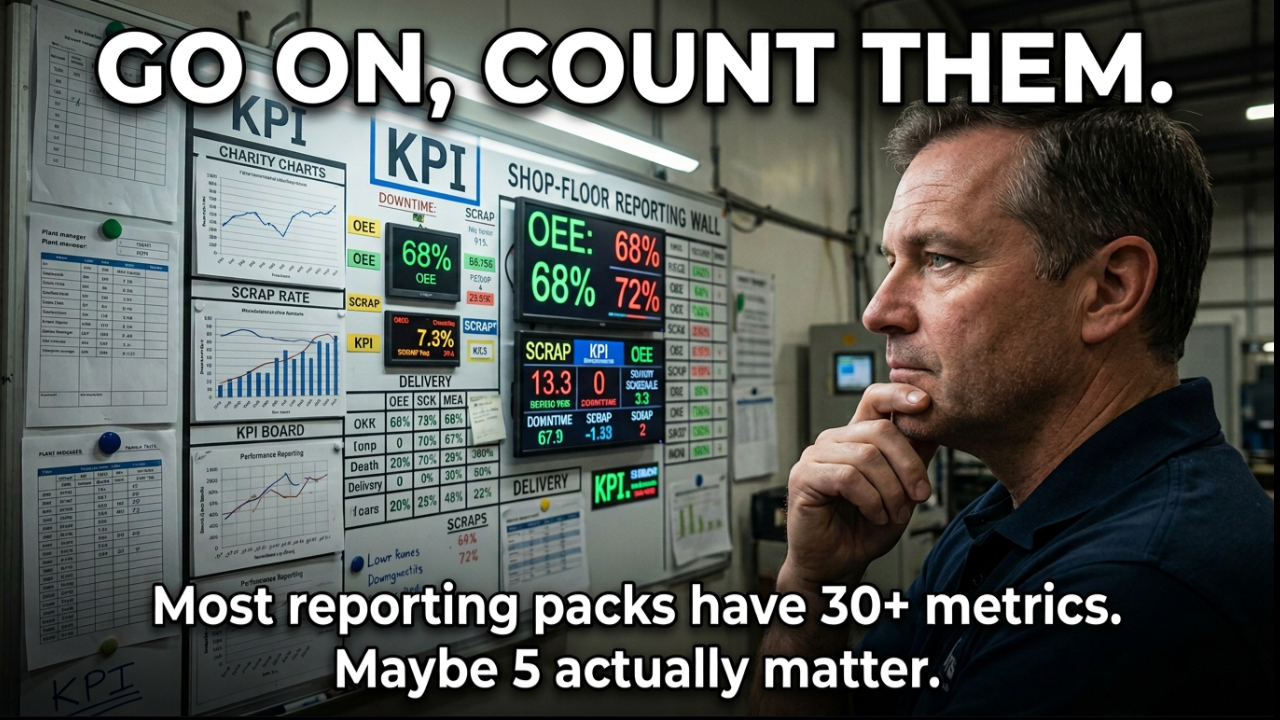
You’re staring at a spreadsheet, the glow of the screen making you feel even more tired. You’ve got dashboards. You’ve got monthly management packs. You’ve got so much data you could probably build a small moon out of it. And yet, when the finance report lands, there’s that familiar, sinking feeling. A surprise. Sales were softer than you thought. A key project went over budget. Again.
Sound familiar?
For so many business owners and leaders, this is the reality. We’re drowning in data but absolutely starved of insight. We have numbers that tell us, with perfect 20/20 hindsight, exactly how badly last month went. We have charts that paint a beautiful picture of the past. The problem is, you can’t steer a car by looking only in the rear-view mirror.
The core challenge is that most of the Key Performance Indicators, or KPIs, that businesses track are what we call lagging indicators. They describe an outcome that has already happened. They report the score after the game is over. This forces you and your team into a reactive loop: see a bad result, demand everyone try harder, and hope for a better result next month. It’s exhausting, and to be honest, it doesn’t really work.
But what if you could change that? What if your KPIs acted less like a report card and more like a satellite navigation system, giving you early warnings and guiding your decisions in real time? This post is about exactly that. We’re going to explore the critical difference between lagging and leading indicators and give you a simple framework to build a small set of KPIs that actually predict performance, not just report on it.
Lagging vs Leading: Managing the Past vs Steering the Future
Let’s get these two terms straight, because understanding them is the foundation for everything else.
A lagging indicator is an outcome metric. It measures the result of past actions. Think of things like:
- Monthly Revenue
- Net Profit
- Customer Churn Rate
- On Time In Full (OTIF) delivery performance
- Customer Satisfaction Score (CSAT)
These are all incredibly important. They tell you if your strategy is working and if the business is healthy. They are the ultimate measures of success. The catch, as we’ve said, is that they come too late. By the time you see your monthly revenue figure, the month is over. You can’t change it. It’s a historical fact. It confirms success or failure, but it doesn’t help you influence it while it’s happening.
A leading indicator, on the other hand, is a predictive metric. It measures the inputs, activities, and behaviours that you believe will drive the future outcome. These are the things that move before the result shows up. For example:
- Number of qualified sales leads generated per week
- Average quote turnaround time
- First pass yield on the production line
- Percentage of team members who have completed critical training
See the difference? A lagging indicator is the destination; a leading indicator is your speed and direction of travel. You can’t teleport to your destination, but you can control the steering wheel and the accelerator right now.
So why do most businesses have dashboards packed with lagging indicators and almost no leading ones? I think it’s because lagging indicators are easy. Your accounting software spits out revenue and profit. Your CRM can probably tell you your customer churn rate. They feel solid and official. Leading indicators require more thought. You have to actively ask, “What are the handful of activities that truly drive our success?” And sometimes, you have to create a new way to measure them. It takes effort, but the payoff is immense.
The High Cost of Rear-View Management
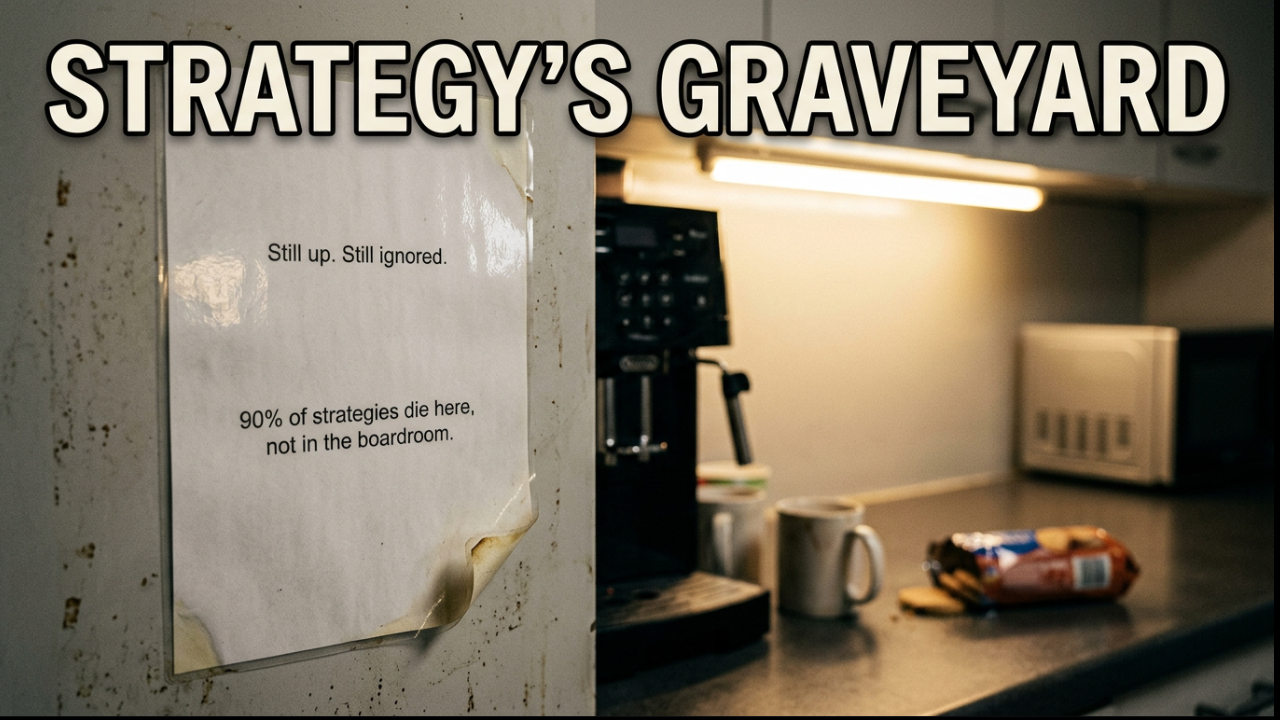
Relying solely on lagging KPIs puts you in a constant state of reaction. It creates a culture of end-of-month fire fighting, where everyone scrambles to make the numbers look good in the final few days. It leads to those frustrating management meetings where the conversation is dominated by phrases like, “We had a tough month, but we’ll do better next month.” How? The plan is usually just a vague commitment to work harder.
This is where the promise of continuous improvement and building a high-performing team falls apart. You can’t run a Plan Do Check Act cycle if the ‘Check’ part only happens once a month, long after the ‘Do’ is finished. Your weekly team meetings become talk shops, reviewing historical data instead of making real-time adjustments.
I remember working with a manufacturing company that was obsessed with its monthly On Time In Full (OTIF) score. Every month, the leadership team would gather, look at the disappointing 85% figure, and the Operations Director would get a grilling. He’d promise to improve it, go back to his team, and tell them to work harder. Nothing ever changed.
The shift happened when we stopped focusing on the OTIF score in the weekly meeting. Instead, we started tracking two leading indicators on a daily basis: schedule adherence (did we do what we planned to do today?) and first pass yield (how many products made it through the process without rework?). Suddenly, the daily stand-up meetings had focus. The team could see a problem today that would have hurt the OTIF score in three weeks’ time. They could solve it right now. The OTIF score, their big lagging indicator, started to climb almost by itself.
Your KPIs should be an early warning system. They should feel like the dashboard of your car, telling you your speed, your fuel level, and if your engine is overheating. They should empower you to steer, not just provide a log of where you’ve been.
The “Measure What Matters Now” Framework
Okay, theory is great, but how do you actually do this? Here’s a simple, four-step framework to build a set of KPIs that will help you steer your business.
Step 1: Start with a Clear Goal
Before you measure anything, ask one simple question: “What outcome are we trying to improve?” Don’t start by looking at the data you have. Start by defining what success looks like in plain English. For example:
- Grow our recurring monthly revenue.
- Reduce the lead time from customer order to delivery.
- Improve our new client onboarding experience.
KPIs should never be collected just because they’re available or because they look impressive on a dashboard. They must be anchored directly to your strategic goals. If a metric doesn’t clearly help you track progress towards a specific, important outcome, you probably don’t need it.
Step 2: Map the Cause and Effect Chain
Once you have a clear goal, work backwards. Ask yourself, “What activities or processes directly drive this outcome?” This doesn’t need to be a complicated Six Sigma process map. Just grab a piece of paper and a pen.
Let’s say your goal is to grow recurring revenue. What drives that? Well, you need to win new customers. What drives that? You need to convert quotes into orders. What drives that? You need to send out high-quality quotes. What drives that? You need to generate qualified leads.
Your chain might look something like this: Qualified Leads → Quotes Sent → Orders Won → Recurring Revenue
Now, look at that chain and circle the points where you can realistically measure a behaviour or a process. You can measure the number of qualified leads your marketing team generates each week. You can measure how many quotes your sales team sends. These are your potential leading indicators. They happen upstream of the final result.
Step 3: Choose a Balanced Set of KPIs
For each goal you identified in Step 1, you want a small, balanced mix of indicators. A good rule of thumb is to have one or two lagging indicators (the result) and two or three leading indicators (the drivers). This gives you the best of both worlds. The lagging indicator confirms you’re actually achieving the goal, while the leading indicators tell you if you’re on track to do so.
I’d also suggest thinking about balance across the business. Instead of having dozens of siloed metrics for each department, try to create a mini balanced scorecard for each major goal. Think about it through four lenses:
- Customer: Are they happy? Are we delivering value?
- Process: Are our internal operations efficient and effective?
- Financial: Are we making money and managing resources well?
- People: Is our team capable, engaged, and developing?
This prevents you from, for example, hitting a production target (a process metric) by burning out your team (a people metric).
Step 4: Test Each KPI: “Is it Real Time and Controllable?”
This is the final, critical filter. For every potential KPI on your list, you must be able to answer yes to these two questions:
- Can the team see movement within a short timeframe (days or weeks, not months or quarters)? If a metric only changes once a quarter, it’s not useful for weekly steering.
- Can the team directly influence it through their actions? The people reviewing the metric must feel a sense of ownership. They need to believe that if they do X, Y, and Z this week, they will see the number move.
If a proposed KPI fails either of these tests, drop it. Revenue is a classic example. A frontline sales team can’t directly control monthly revenue. But they can control how many follow-up calls they make each day, or how many product demos they book. Those are controllable, real-time leading indicators.
Concrete Examples: From Theory to Practice
Let’s make this even more tangible. Here are some examples of how this lagging vs. leading split looks in different parts of a typical business.
For a Sales and Marketing Team
- Lagging Examples: Monthly Sales Revenue, Customer Lifetime Value, Average Margin, Win Rate.
- Leading Examples: Number of Qualified Leads Generated per Week, Demos Booked, Quotes Sent Within 24 Hours, Follow-Up Calls Made per Opportunity.
When you shift the weekly conversation from “How is revenue looking?” to “How many qualified leads did we generate this week?”, you change the entire dynamic. Sales and marketing are no longer seen as just ‘overhead’. Their weekly activities are directly and visibly linked to the future health of the business.
For an Operations or Delivery Team
- Lagging Examples: On Time In Full (OTIF), Total Output, Scrap Rate, Overall Equipment Effectiveness (OEE).
- Leading Examples: Daily Schedule Adherence, First Pass Yield, Machine Changeover Time vs Standard, Number of Standard Work Audits Completed.
These leading indicators are what make daily stand-up meetings and visual management boards powerful. Instead of just reviewing yesterday’s output, the team can look at the schedule adherence for the first two hours of the shift and know, right now, if they are on track. They can solve problems in the moment, not in a post-mortem meeting next month.
For People and Capability
- Lagging Examples: Staff Turnover Rate, Absenteeism, Annual Employee Engagement Score.
- Leading Examples: Percentage of Critical Training Completed, Cross-Skilling Coverage (how many people can do each key task?), Frequency of One-to-Ones, Number of Improvement Suggestions Submitted.
High-performing teams don’t just happen. They are built. By the time your staff turnover rate spikes, the underlying problems have been festering for months. Tracking the completion of training or the number of one-to-ones gives you a real-time pulse check on whether you’re investing in your people. It’s a leading indicator of future engagement and retention.
Time to Audit and Upgrade Your KPIs
So, back to you at your desk, staring at that spreadsheet. It doesn’t have to be that way. You can move from being a scorekeeper of the past to a true captain of your ship, steering it towards the future you want to create.
I invite you to run a quick ‘KPI health check’ this week. It’s a simple but powerful exercise:
- List out all the current KPIs you review regularly.
- Next to each one, label it as either ‘Lagging’ or ‘Leading’.
- Be honest. What’s the balance? My guess is it’s heavily weighted towards lagging.
- Now, make a bold move. Drop at least three KPIs that only describe the past and add three new leading indicators that your team can track and influence every single week.
This small change can have a profound impact on your focus, your team’s engagement, and ultimately, your results.
If you’re ready to stop managing the past and start creating the future, this is the first step. And if you’d like some help, our Execution OS Programme is designed to do just that. We work with you to redesign your KPI set, align it with your strategy, and build a simple, powerful review rhythm so you can finally predict your performance, not just report it.
Additional Resources:
For further material on related topics, consider exploring the following:
- 5-tell-tale-signs-your-strategic-plan-is-destined-to-gather-dust
- The Strategic Alignment Scorecard
- Crack the Marketing Code: The Power of 20 Strategic Questions
- The Ultimate Guide to Writing OKRs That Don't Suck
- Unlock the Plan That Works Harder Than You Do, So You Can Step Back and Guide Your Team.
Reclaim your momentum, energy, and confidence.
Contact us
now and let’s turn your business strategy into unstoppable progress.
Phone: 0330 311 2820
We look forward to helping you discover your unique path to growth, strategies that fit you - not the other way round.
Pay It Forward! Sharing Is Caring!